
From footnote #5, Theorizing Visual Studies — “How to Use This Book”:
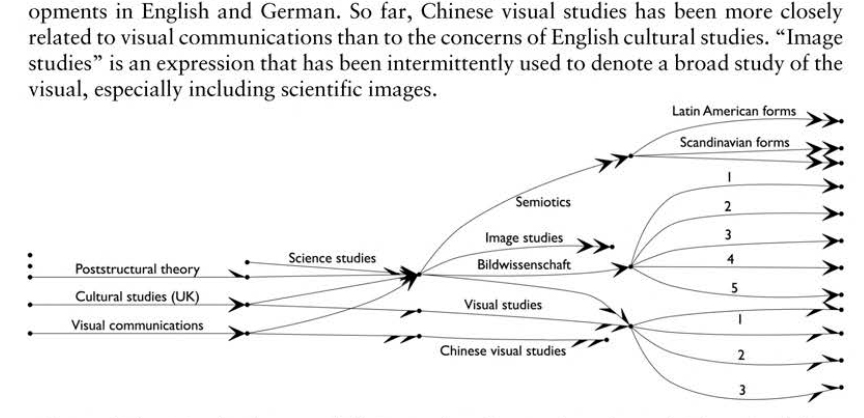
5. The graph is heuristic rather than quantifiable. In general, graphs are understood as purely informational objects, whose task is to communicate sometimes intricate data fields in formats that are pleasing, memorable, and immediately comprehensible. In keeping with this book’s critical intentions, some graphs and time lines behave more like art objects in the specific sense that they also contain forms that cannot be read. In this case, the graph mingles commonly made connections with speculative ones. It also contains signs, such as the extra dots at the upper left and the variety of left- and right-handed arrowheads, whose significance is not explained. The idea is to let the graph work more broadly, more openly, so that it can suggest information and ideas instead of merely illustrating data.
Elkins, James. Theorizing Visual Studies (5-6) 2012.